
Mars Global Surveyor Magnetic Field Experiment
Mars Global Surveyor Magnetic Fields Data from AB-1
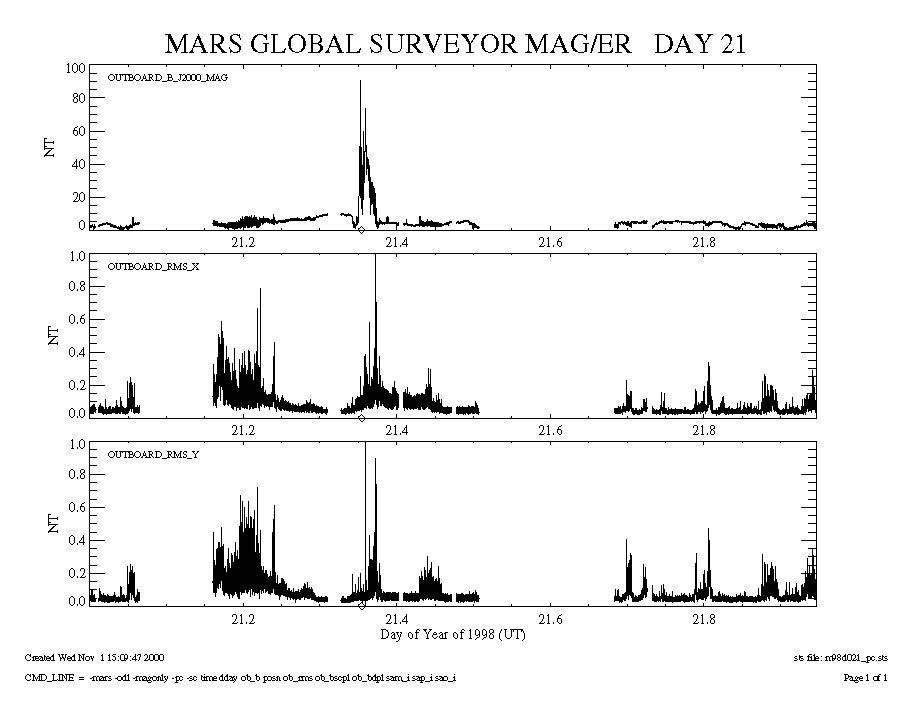
Here is an example of some data collected by the MGS magnetometer during the first Aerobraking Phase (AB-1). This data has been corrected with the June 2000 model of the spacecraft field.
This data was collected on day 021 (January 21) of 1998 during the periapsis pass of the day. The top plot shows the magnitude of the magnetic field (|B|) versus time. The lower two plots show the root-mean-square (RMS) values for the X and Y components, respectively, of the magnetic field versus time. The RMS is a measure of the variability or scatter in the data which is used to evaluate the quality of the data. The diamonds on the x-axis mark the times of periapsis.
Click on picture for larger view
- NASA Official: Ron Oliversen
- Email: Ronald.J.Oliversen@nasa.gov
- Curator: Patricia Lawton, ADNET Systems, Inc.
- Email: Patricia.J.Lawton@nasa.gov
- Last Modified: 17 January 2017