Mars Global Surveyor Magnetic Field Experiment
Mars Global Surveyor Magnetic Fields Data from
SPO-1
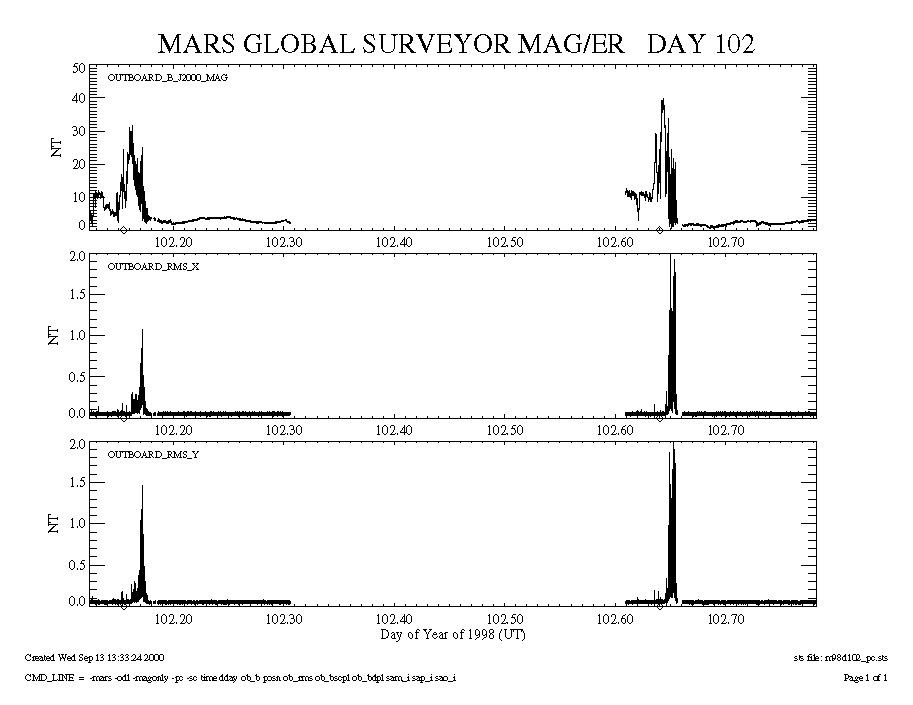
This data was collected on day 102 (April 12) of 1998 during the first and second periapsis passes of the day. The top plot shows the magnitude of the magnetic field (|B|) versus time. The lower two plots show the root-mean-square (RMS) values for the X and Y components, respectively, of the magnetic field versus time. The RMS is a measure of the variability or scatter in the data which is used to evaluate the quality of the data. The diamonds on the x-axis mark the times of periapsis.

Click on picture for larger view
Contributors: David Brain, Monte Kaelberer, and Cisco Perin


